For the longest time, KDP aggregated all sales information by week. Now KDP has nice graphical breakdowns of daily sales. Naturally, I wondered if my sales averages differed significantly by the day of the week. I compiled an Excel spreadsheet to give me a quick answer. Apparently the day of the week does not an impact for me, at least not in any significant way.
Still, I figured others would want to know the same information. As such, I did a little bit of extra work on the spreadsheet to make it usable for others. You can download it here. It is very simple to use. Just follow these four steps:
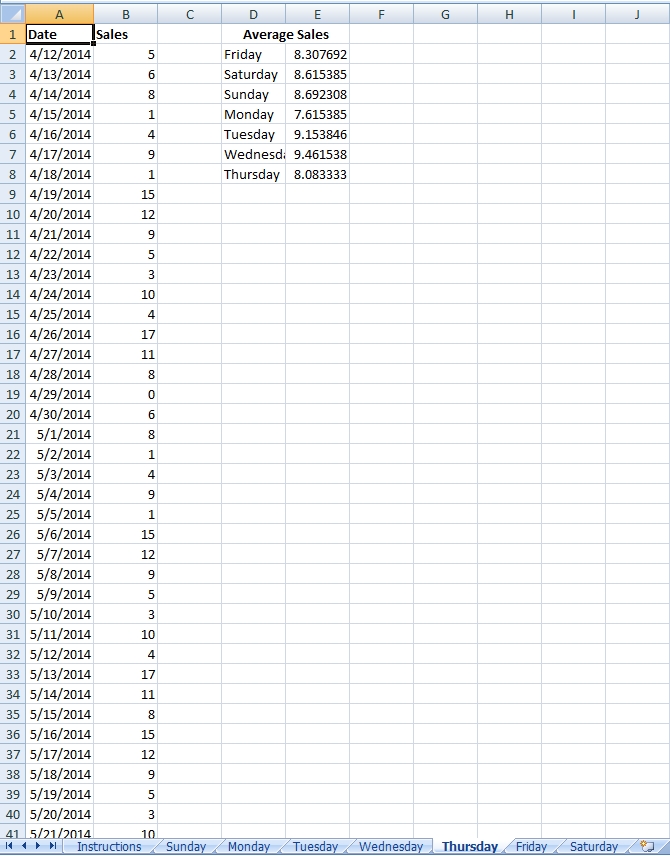
1) Select the tab in Excel that corresponds to the current day of the week. (For example, if today is Tuesday, use the Tuesday tab.)
2) Go to KDP’s sales dashboard. Use one of the pull down menus to open the last 90 days of sales. This will give you the most days to average over.
3) Copy each day of sales from the graph to the spreadsheet. This will require some work because you have to do it manually and need to pay close attention to graph to make sure you are copying down the correct number.
4) Excel will automatically calculate each day of the week’s average sales.
Again, you can download it here. Let me know what you think.